The measurement problem
Workplace geography is usually described with a few major districts or a current map. The census source supports a more disciplined historical question. It records active establishments and workers attached to those establishments across 773 valid lower-area polygons in 2011.
The unit matters. These are workplace counts, not residents, firms observed over time, or origin-destination commuter flows. The paper therefore measures the spatial structure visible in the establishment-centred census and keeps later interpretation inside that boundary.
Ten centres under the primary rule
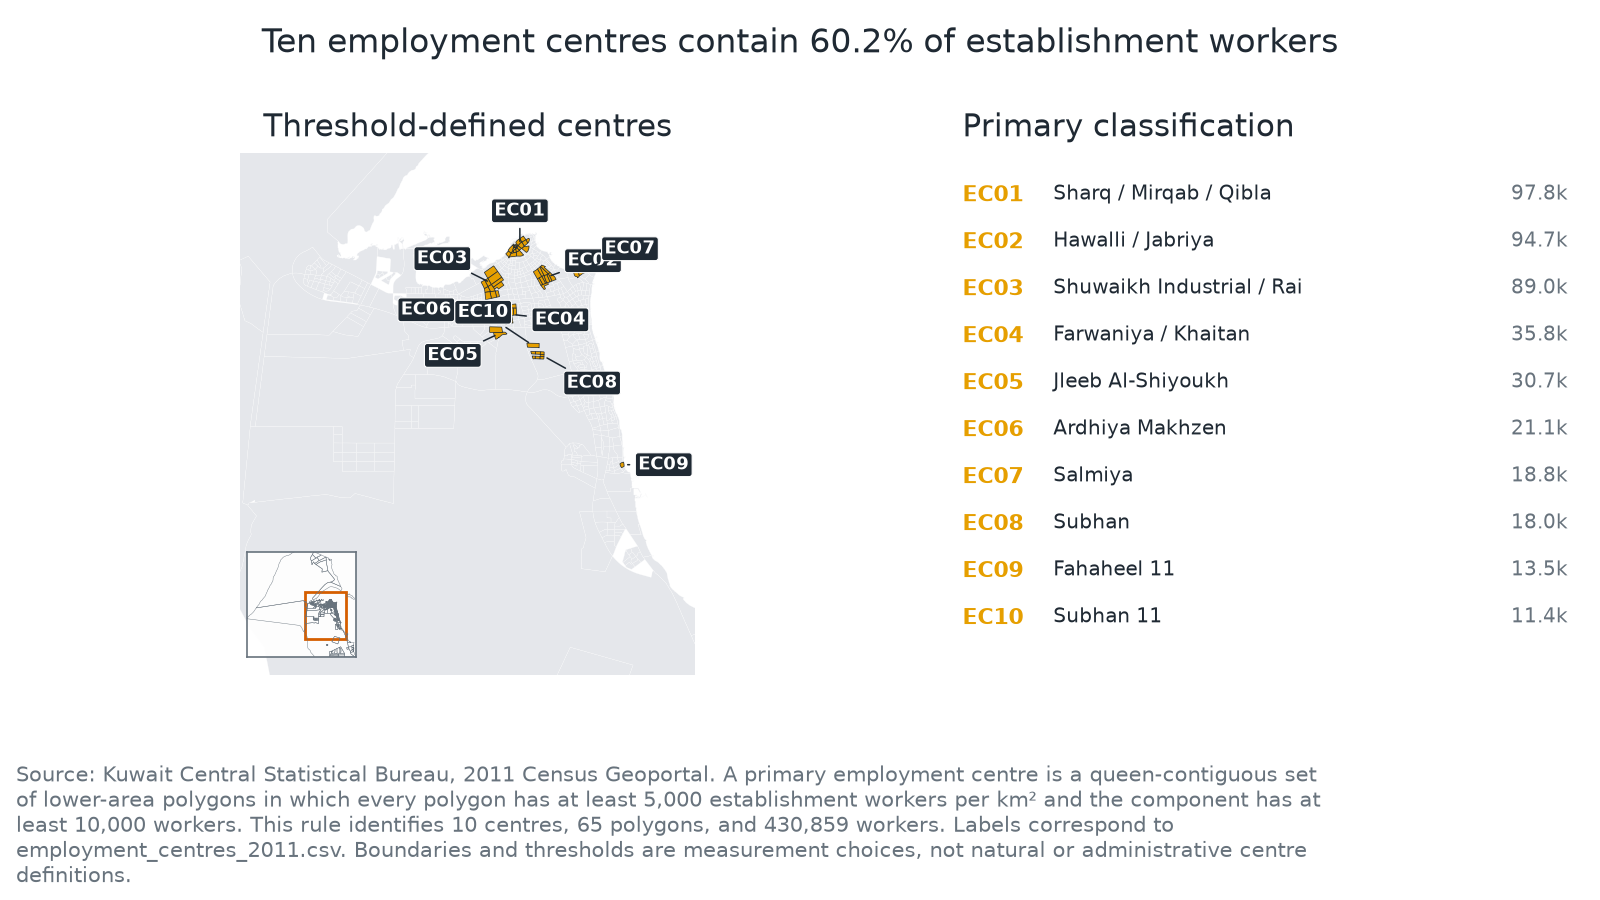
The primary classification requires every member polygon to contain at least 5,000 establishment workers per square kilometre. Touching qualifying polygons are joined with queen contiguity, and a component must contain at least 10,000 workers to remain a centre.
View full-size figure (opens in a new tab)
Sharq, Mirqab, and Qibla form the largest centre with 97,850 workers. Hawalli and Jabriya follow with 94,682, then Shuwaikh Industrial and Rai with 88,979. Across nine transparent threshold combinations, the classification contains 5 to 12 centres and captures 37.9% to 71.9% of establishment workers.
Workers, establishments, and residences tell different stories
Workers were more spatially concentrated than establishments. The top ten polygons contained 24.5% of workers and 19.4% of establishments. The inverse-HHI effective count was 74.5 polygons for workers and 118.7 for establishments. This is geographic concentration, not product-market concentration.
View full-size figure (opens in a new tab)
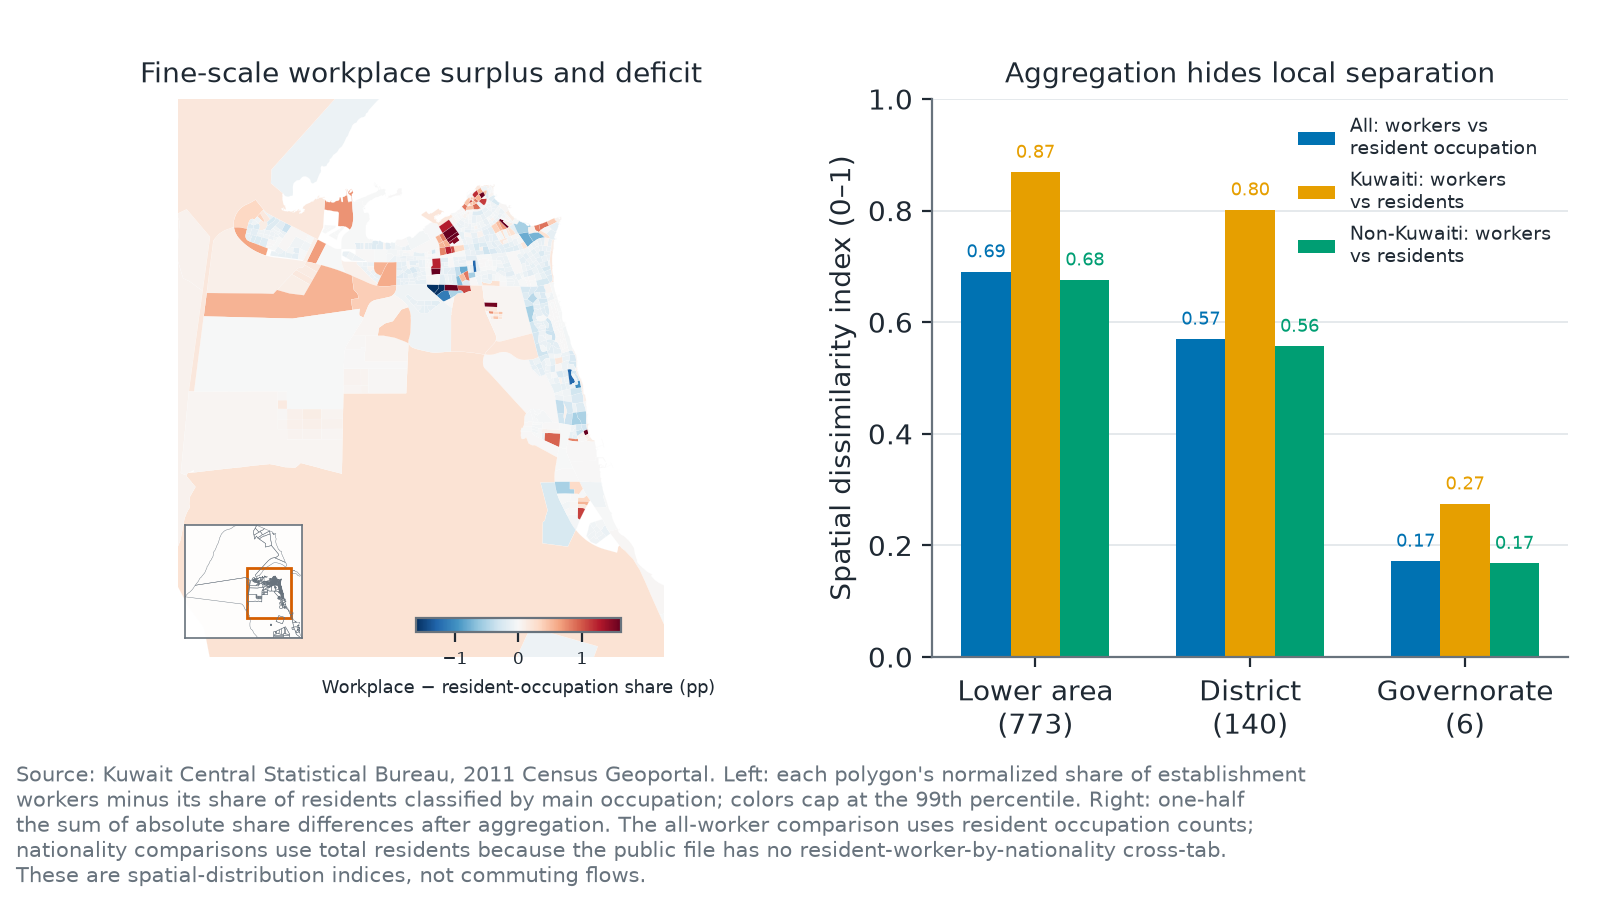
The scale comparison is the paper's main spatial lesson. Workplace-residence dissimilarity is 0.691 across 773 lower areas, 0.570 across 140 districts, and 0.172 across six governorates. Coarse geography hides much of the fine-scale separation.
What the paper does and does not establish
The paper provides a reproducible 2011 baseline for workplace concentration, centre classification, and workplace-residence separation. It does not describe Kuwait's current workplace geography, identify official employment centres, observe commuting flows, or estimate agglomeration and transport effects.
The workplace and residence universes also differ. Nationality comparisons use all residents because the public file does not identify resident workers by nationality. That limitation is part of the result, not a footnote to be removed.
Citation and sources
Suggested citation: Abdulmalik Altararwa. 2026. "The Workplace Structure of Kuwait in 2011." Working paper.
Sources: The analytical source is the Kuwait Central Statistical Bureau 2011 Census Geoportal. All public figures show aggregate geography only.
Public-release boundary: This page publishes aggregate estimates, original figures, and source links. It does not publish raw records, restricted data, or local research files.